

How Much Americans Made in 2018 – Numbers Tell Stories Series – Part I
ArticlesBy AccountingGo Staff
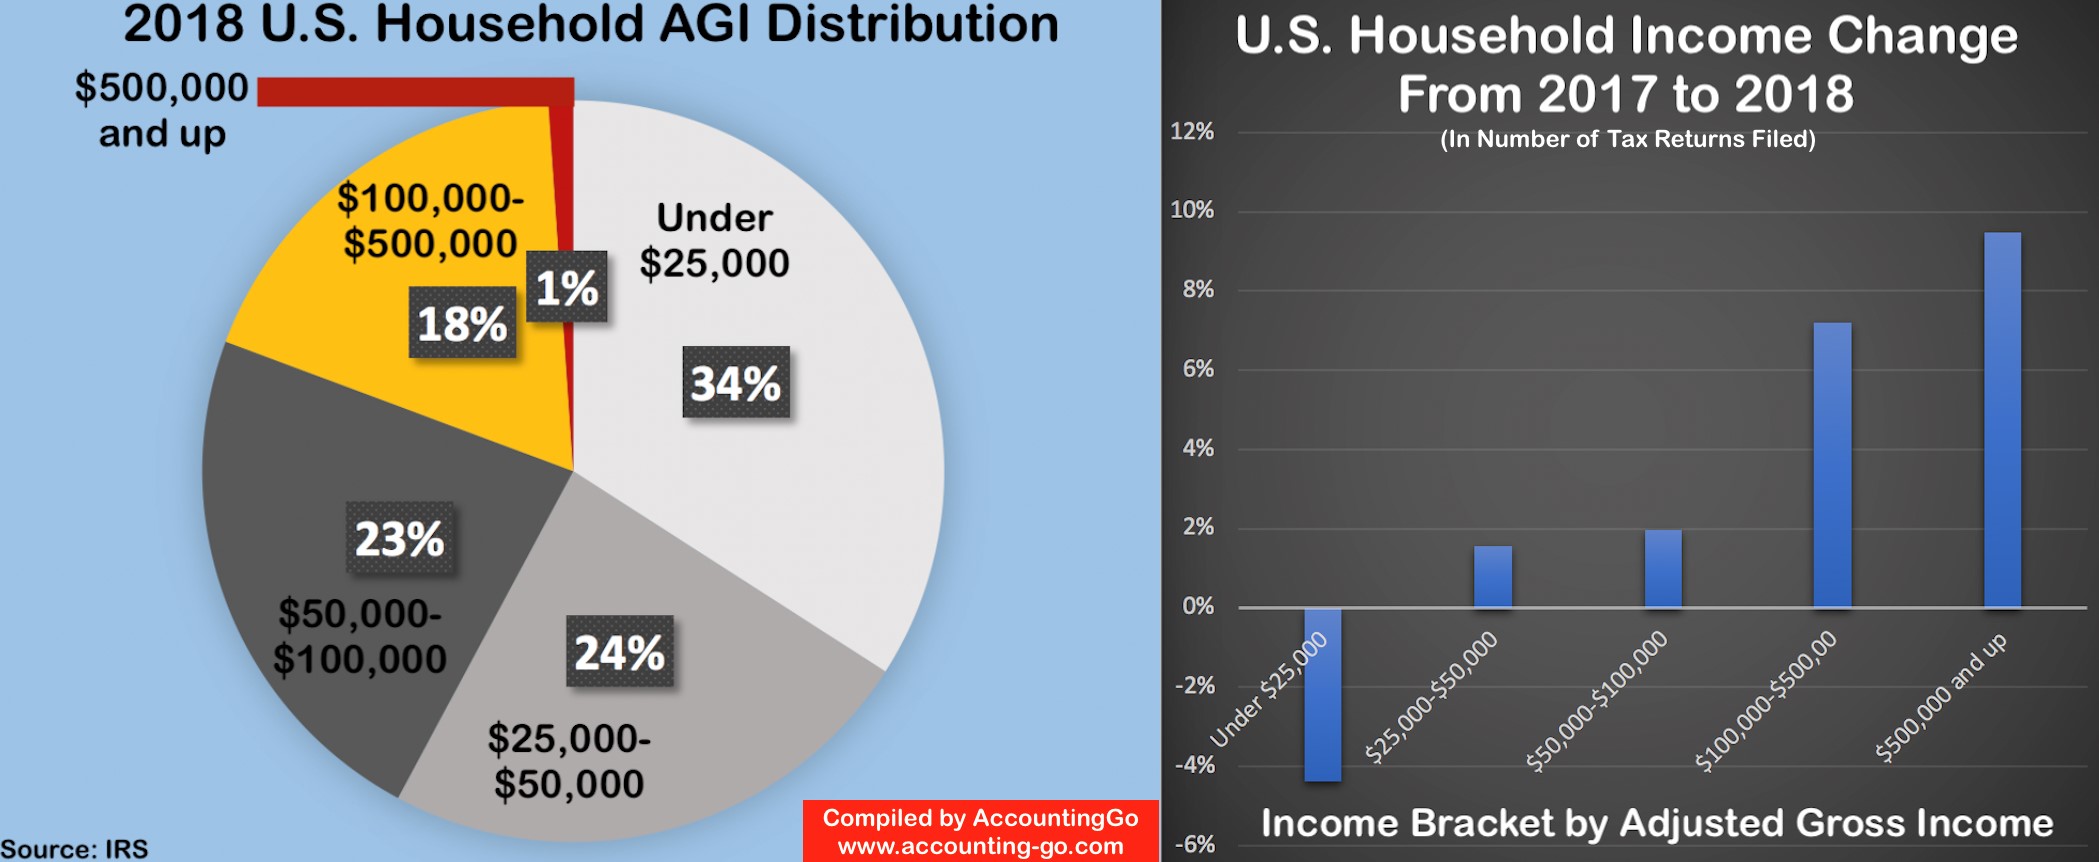
Per the most recent data released from the IRS, there were approximately 153.8 million individual income tax returns filed for year 2018. Of those returns, approximately 58% reported adjusted gross income (AGI) of $50,000 or less, 23% between $50,000 and $100,000, and 19% reported income of $100,000 or more – See the pie chart for more details.
These numbers reflect a big change compared to 10 years ago when 65% of U.S. returns reported an adjusted gross income of less than $50,000 and only 13% of U.S. returns reported an adjusted gross income of $100,000 or more. Although they haven’t been adjusted for inflation.
When comparing 2018 to 2017, the numbers also show a noticeable increase in income reported to the IRS across all income brackets – See the bar chart. The data shows a drop of more than 4% for those making less than $25,000 per year, probably because of the increase in minimum wage in some jurisdictions. The same data shows an increase of more than 7% for those households making between $100,000 and $500,000, and more than 9% for those making more than $500,000. The big increase in the upper-income households was probably because of the appreciation in value of stocks, real estate and other investment assets.
This article can be republished in its entirety with accreditation to AccountingGo and website: www.accounting-go.com